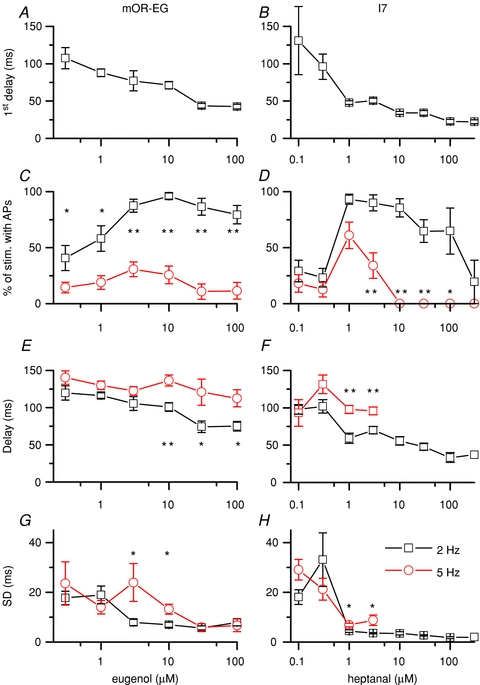
Figure 6. Response delay and reliability of action potential generation.

Analysis of the recordings from mOR-EG and I7 ORNs. A and B, the delay of the first action potential generated in response to the first eugenol or heptanal stimulus at t = 0, respectively. C and D, percentage of stimulations that elicited action potentials at 2 and 5 Hz. E and F, delay of action potential firing averaged over all 2 and 5 Hz odorant stimulations in a given sweep. G and H, average of the standard deviations obtained from each cell for the AP delay. Data points are means ± SEM of 9–15 ORNs for mOR-EG ORNs and 3–17 for I7 ORNs. Statistical significance: *P < 0.05 and **P < 0.005, two sample t test.
