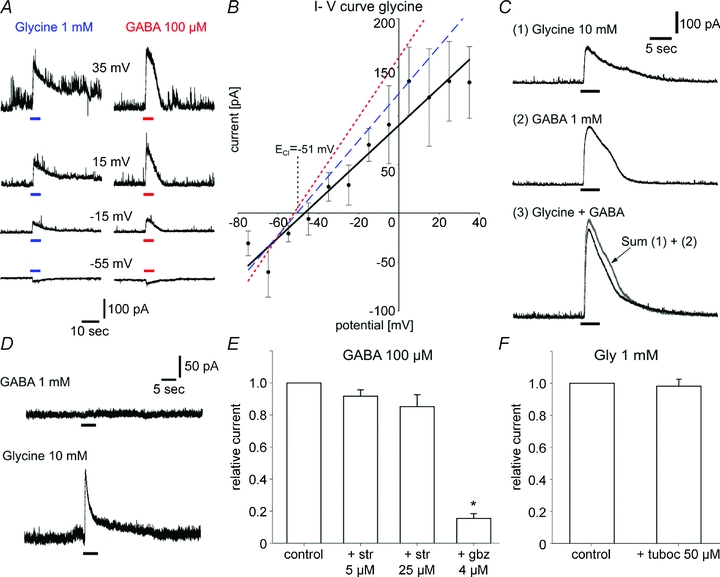
Figure 3. Ion selectivity and specificity of the glycine-induced current.

A, currents induced by 1 mm glycine (left traces) and 100 μm GABA (right traces) are recorded at different holding potentials in the same neuron. Note the longer duration of the deactivation phase after glycine application compared to GABA. B, current–voltage relationship for glycine in SCN cells from acute slices (mean values ± SEM of 4 to 12 SCN neurons). The measured reversal potential (−47.1 mV) approaches the equilibrium potential for chloride under these recording conditions which was ECl=−51 mV. The dashed line and dotted line represent the current–voltage curves for glycine-induced and GABA-induced currents in the cell in A, respectively (reversal potentials: glycine, −49.2 mV; GABA, −50.1 mV). C, co-application of saturating concentrations of glycine (10 mm) or GABA (1 mm) induced a current of lower amplitude than the arithmetic sum (3, in grey) of glycine- (1) and GABA- (2) induced currents (n = 12). D, example of a recording from a SCN neuron where glycine (10 mm) induces an outward current at a holding potential of 0 mV (lower trace). The cell is unresponsive to GABA application (1 mm, upper trace). E, strychnine does not significantly decrease the amplitude of the current induced by 100 μm GABA. In contrast, 4 μm gabazine effectively suppresses this current (85%). n = 12. *P < 0.05. F, the nicotinic acetylcholine receptor tubocurarine (50 μm) does not affect glycine-induced currents (n = 10).
