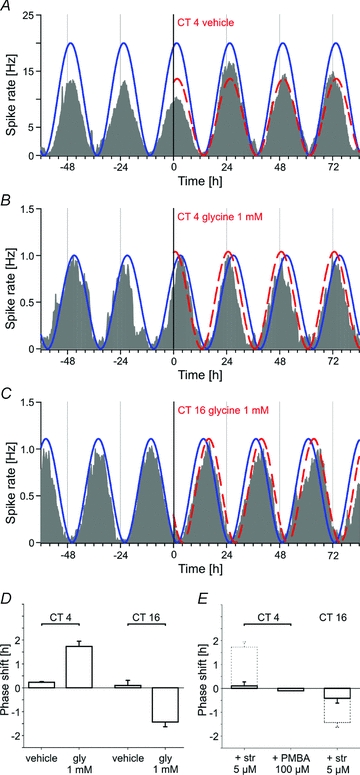
Figure 5. Glycine phase-shifts the circadian rhythm of the firing rate of SCN neurons.

The different shaded traces represent the average activity recorded from all electrodes of a MEA that exhibit rhythmic activity (n = 9–45). In each case, application of vehicle or 1 mm glycine occurs at time = 0 h. The calculated cosine curves are shown as an overlay on the recording traces. The continuous curve indicates the original phase and the dashed line the phase after application. A, example of a vehicle application at CT 4 showing no shift of the circadian oscillation of the firing rate. B, example of a phase advance induced by 1 mm glycine (1.8 h) at the same circadian time. C, example of a phase delay (−1.7 h) following application of 1 mm glycine at CT 16. D, phase–response histograms for vehicle and glycine at CT 4 and CT 16 (n = 64–167 cells in 3–7 explants). E, phase–response histograms showing the effect of co-application of strychnine (5 μm) and glycine (1 mm) at CT 4 and CT 16 (n = 114–130 cells in 5 explants). The histograms with dashed lines illustrate the results obtained with glycine alone. The co-application of PMBA (100 μm) with glycine done in a single experiment, confirms the results obtained with glycine.
