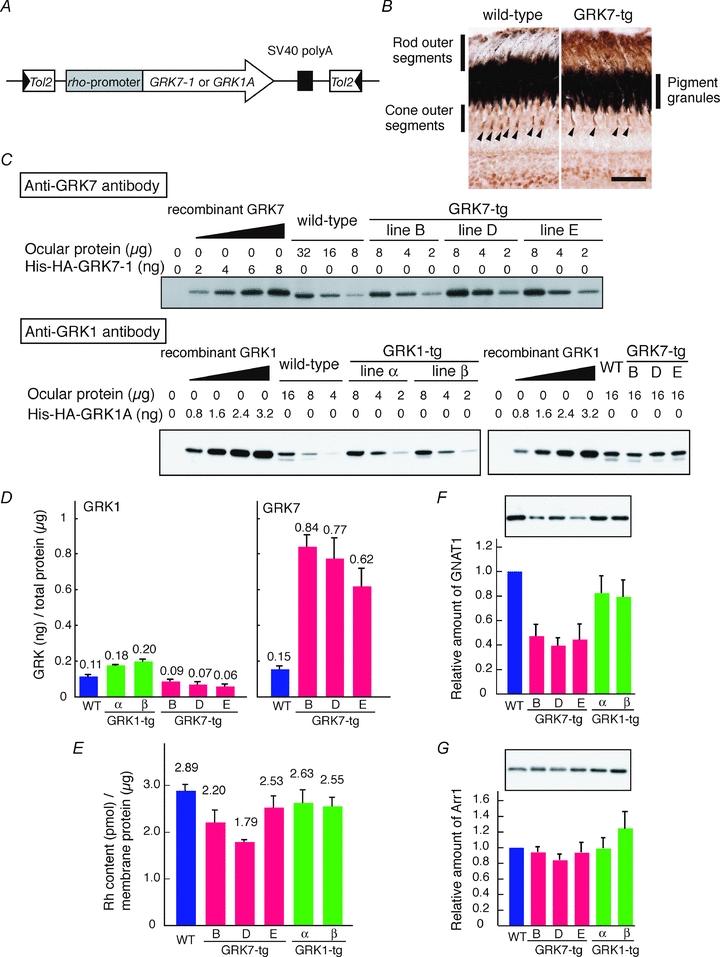
Figure 1. Expression of GRKs in transgenic zebrafish rods.

A, schematic diagram of the transgene introduced into the GRK7- or GRK1-tg lines. B, retinal sections of adult wild-type and GRK7-tg fish were immunostained with anti-carp GRK7 antibody; scale bar, 20 μm. C and D, expression levels of GRK7 in GRK7-tg eyes, and of GRK1 in GRK7-tg and GRK1-tg eyes, were assessed by immunoblot analysis of serial dilutions of ocular homogenates from age-matched wild-type and transgenic zebrafish. The amount of protein loaded onto each lane is indicated. His-HA-tagged recombinant GRK proteins, His-HA-GRK7–1 and His-HA-GRK1A, (Wada et al. 2006), were used as standards for the calibration of ocular GRK protein levels. The ocular homogenates and His-HA-tagged recombinant GRK proteins were mixed with zebrafish brain homogenate to adjust the total amounts of proteins to the same level so as to eliminate any difference between the samples in masking effects of non-GRK proteins. Note that the zebrafish brain homogenate showed no detectable immunoreactivities to the primary antibodies against GRKs. Typical immunoblot images are shown in C. The estimated amounts of both GRK1 and GRK7 proteins per total ocular protein are shown in D. Averages (also indicated as numbers) from three independent experiments are shown with SEM. Note that the GRK1 levels (left panel in D) contain GRK1B, which is expressed in cones (Wada et al. 2006). The GRK1B levels are estimated to be 0.018 ng per μg of total protein according to Wada et al. (2006). On the other hand, the GRK7 levels in GRK7-tg (right panel in D) contain GRK7 intrinsic to cones, which is estimated to be 0.15 ng per μg of total protein. After subtracting the amounts of GRK1B and GRK7 in the cones, the ratio of GRK7:GRK1 expression in the rods was estimated as 10:1 for each of the three lines of GRK7-tg animal. E, rhodopsin content in ocular membrane extracts estimated by spectrophotometric measurement. Averages from 10 wild-type fish, five GRK7-tg fish and four GRK1-tg fish are shown with SEM. F and G, expression levels of rod transducin α subunit (GNAT1, F) and rod arrestin (Arr1, G) in ocular homogenates. Top, typical immunoblot images from wild-type and transgenic zebrafish. Bottom, protein expression levels in the eyes of transgenic fish relative to those of wild-type. In each lane, ocular homogenate containing 3.2 μg of total protein was loaded. Averages from four to six independent experiments are shown with SEM.
