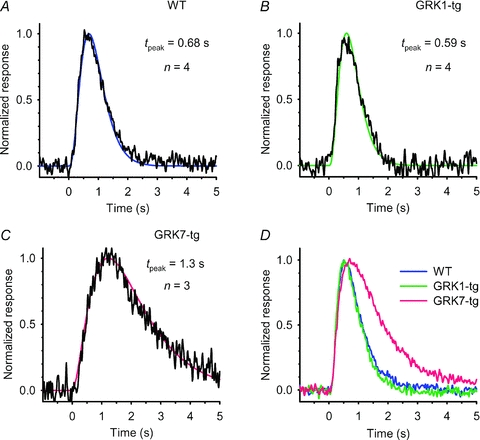
Figure 4. Dim-flash response kinetics for rods of the three genotypes.

A–C, dim-flash responses from a representative rod of each genotype: A, WT; B, GRK1-tg; C, GRK7-tg. The responses have been normalized to unit amplitude, and have been fitted with the kinetic form of eqn (3) with the parameters tpeak, n, and rpeak set as follows: A, WT: 0.68 s, 4, 0.51 pA; B, GRK1-tg: 0.59 s, 4, 1.3 pA; C, GRK7-tg: 1.3 s, 3, 0.59 pA. D, population mean responses for rods of the three genotypes. Normalized responses from the individual rods were averaged across each genotype, and then re-normalized (to compensate for the reduction that occurred because of dispersion in tpeak). The mean and SEM for the time-to-peak (and the number of rods averaged) are listed in Table 1.
