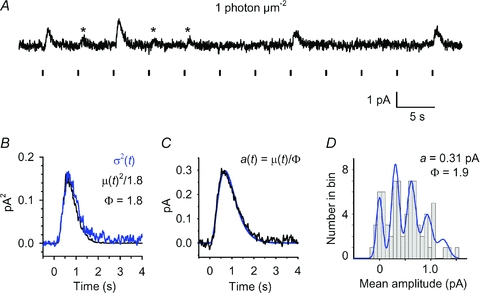
Figure 5. Analysis of quantal responses in a WT rod.

A, set of 12 consecutive responses from a WT rod for flashes of fixed dim intensity (∼1 photon μm−2) delivered at 5 s intervals, as indicated by vertical markers below the trace. Presumed unitary events (single photon responses) are indicated by asterisks. B–D, variance analysis and histogram analysis on 73 responses of the kind illustrated in A. B, ensemble variance, σ2(t) (blue trace), together with a scaled version of the square of the mean response, μ(t)2 (black trace); with a scaling factor of 1/1.8 the two traces coincided closely, yielding an estimate for the number of photoisomerizations as ϕ= 1.8; see eqn (4a). C, estimated quantal response, a(t), obtained by dividing the mean response by the estimate for ϕ; see eqn (4b). The blue curve plots the Poisson kinetics of eqn (3), with amplitude rpeak= 0.3 pA, tpeak= 0.68 s, and n = 4. D, amplitude histogram for the 73 responses, measured over a window 0.5 s wide centred at tpeak, and using a bin width of 0.05 pA. The blue curve plots the sum of Poisson-weighted Gaussian components, as described in eqn (10) of Baylor et al. (1979b), using parameters: a = 0.31 pA; ϕ (=m) = 1.9; σ0= 0.045 pA; σ1= 0.045 pA.
