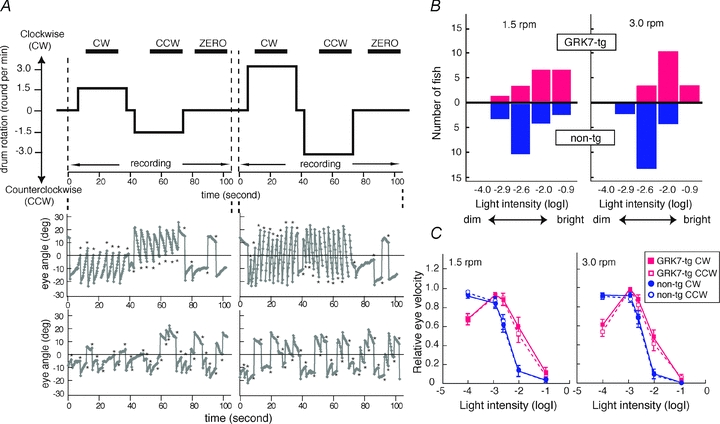
Figure 9. Optokinetic responses for rod-mediated vision of zebrafish larvae deficient in cone function (els/els).

A, representative measurements of OKR and their analysis. Top, time course of drum rotation. The drum first rotated clockwise (CW) and then counterclockwise (CCW) at 1.5 rpm. After a resting period (ZERO), it rotated at 3 rpm in a similar manner. The horizontal bars at the top indicate the periods used for data processing. Middle and lower panels, representative measurements of eye orientation for two intensities of illumination; −2.0 and −0.9 log units. Middle, at low intensity, the larva showed OKR, consisting of smooth pursuit eye movements followed by rapid saccades (asterisks) in the opposite direction. Bottom, at high intensity, the same larva did not display OKR and the eyes moved apparently at random. B, comparison of maximum light intensity to induce OKR for rod-mediated vision in non-transgenic and GRK7-transgenic larvae. In each fish and for each speed, we determined the maximum light intensity at which they showed OKR. The bar graphs plot the distributions of the numbers of fish exhibiting the indicated maximal intensities for eliciting OKR. The distribution for the GRK7-transgenic larvae (red upward bars) was significantly shifted to the right (i.e. to higher intensities) compared with the distribution for non-transgenic larvae (blue downward bars), as statistically examined by Mann–Whitney's U test (left, P = 0.011; right, P = 0.00020). C, averaged eye velocity for non-transgenic larvae (blue symbols) and GRK7-tg larvae (red symbols) plotted as a function of light intensity. The direction of rotation is indicated: CW, filled symbols, continuous lines; CCW, open symbols, broken lines. Averages with SEM from 16 GRK7-tg fish and 19 non-transgenic fish are shown.
