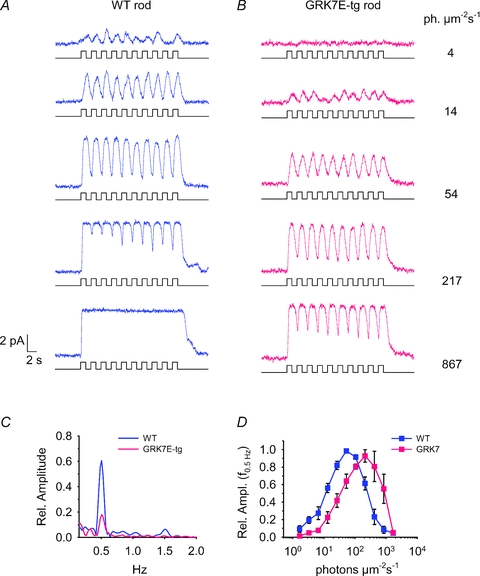
Figure 10. Responses of zebrafish rods to repetitive steps of light at 0.5 Hz.

Stimuli consisted of 10 steps of light of 1 s duration, separated by dark periods also of 1 s duration. A, responses of a representative WT rod to stimulation at progressively higher intensities. Rectangular traces below each response mark the time course of illumination. At the highest intensity the response remains saturated during the intervals of darkness between the steps of illumination. B, responses of a representative GRK7-tg rod to illumination of identical time course and intensity as in A. The response is negligible at the lowest intensity, and at the highest intensity the response does not remain in saturation during the dark intervals. C, amplitude spectra of the responses at a single intensity (14 photons μm−2 s−1), for the traces in A and B, computed by fast Fourier transform (FFT) analysis. Segments of 20.48 s duration were selected, comprising 4096 points sampled at 200 Hz, beginning at stimulus onset; the amplitudes have been normalized relative to the maximum amplitude of the fundamental (0.5 Hz) component in each rod. Note the smaller relative amplitude of the fundamental component in the GRK7-tg rod (red trace). D, averaged amplitude of the fundamental component as a function of light intensity for WT and GRK7-tg rods; results from 3–6 cells have been averaged at each intensity. For GRK7-tg rods the relationship is shifted to the right (to higher intensities).
