
Figure 1. Excitation frequency dependence of conduction slowing and block at regions of geometrical expansion.
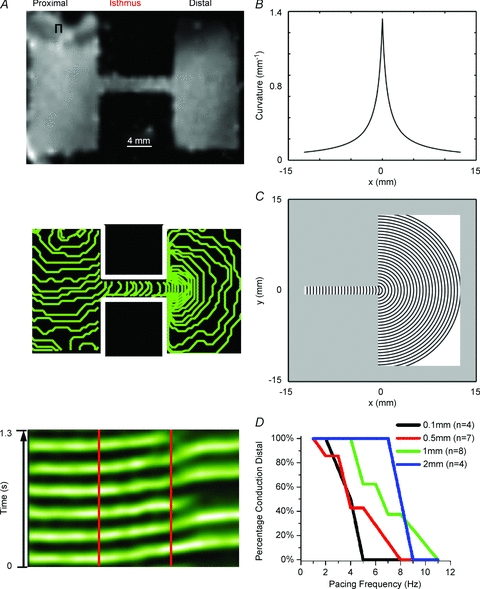
A, top panel, uninfected patterned monolayer (1-mm-wide isthmus). A, middle panel, activation map of a patterned NRVM monolayer with a 1-mm-wide isthmus that was paced at 6 Hz, showing 5 ms isochrone lines. A, bottom panel, average time–space plot (TSP) for pixels along horizontal lines that traversed the isthmus from the same preparation when the excitation frequency was increased to 7 Hz (red lines demark the structural heterogeneity). There was conduction slowing at the distal expansion and subsequent conduction block in a 3:2 pattern of conduction to block distally. B, curvature profile along the cable. C, wavefronts (spaced every 0.5 mm) corresponding to the curvature shown in B. There is a 0.75 mm (r0) offset between the location of the highest curvature along the 1D cable (B) and the isthmus–expansion interface in the 2D system (C). This relates to the geometrical properties of the wavefront; the wavefront with the highest curvature (thus the smallest radius, r0) has its right-most point at x0= 0 (according to B) and its centre at x=−r0. D, percentage of the preparations at each isthmus width and pacing frequency that sustained propagation into the distal expansion.