
Figure 3. Characterization of Ad-Nav1.5 expression.
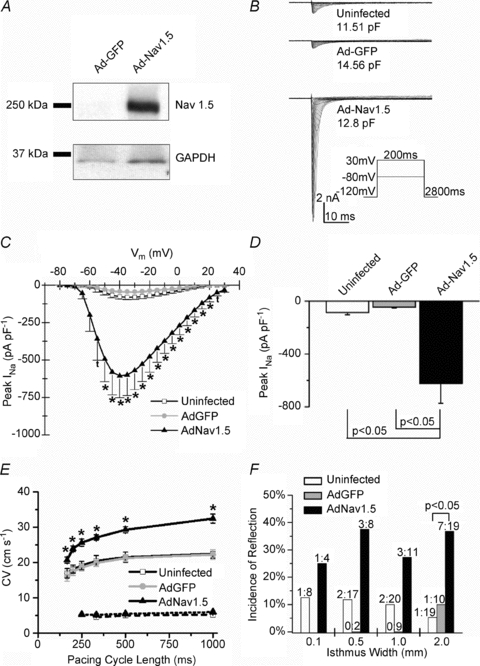
A, representative Ad-Nav1.5 Western blot. Top, Nav1.5 expression; bottom, GAPDH as the loading control. B, representative INa family of traces. C, current–voltage relation of INa. The INa density was significantly larger in the Ad-Nav1.5 group vs. uninfected (t, P < 0.05,) or both uninfected and Ad-GFP (*P < 0.05, N = 6–8, n = 8–12). D, the peak INa density in the Ad-Nav1.5 group. E, conduction velocity (CV) in homogenous NRVM monolayers at various pacing cycle lengths. The CV was significantly faster at all cycle lengths in the Ad-Nav1.5 group vs. uninfected and Ad-GFP groups (*P < 0.05, continuous lines, n = 3–8 monolayers). Upon INa blockade (30 μm TTX), the CV decreased to 4.5–6.0 cm s−1 in all three groups (dotted lines, one-way ANOVA and Tukey's test). F, incidence of reflection for each isthmus width (P < 0.05, χ2 test).