
Figure 4. Persistent INa.
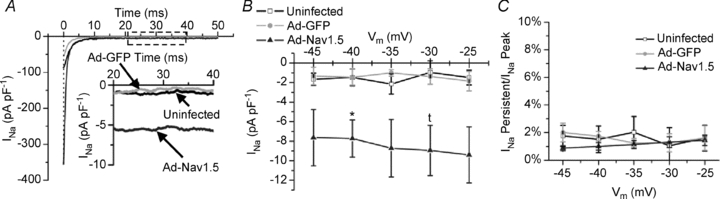
A, representative traces of TTX-sensitive persistent INa in each group. B, quantification of the persistent INa (N = 2–3, n = 3). C, TTX-sensitive persistent INa normalized to the TTX-sensitive peak INa for each trace as a percentage. One-way ANOVA and Tukey's test.