
Figure 7. Reflection in the Ad-Nav1.5 group.
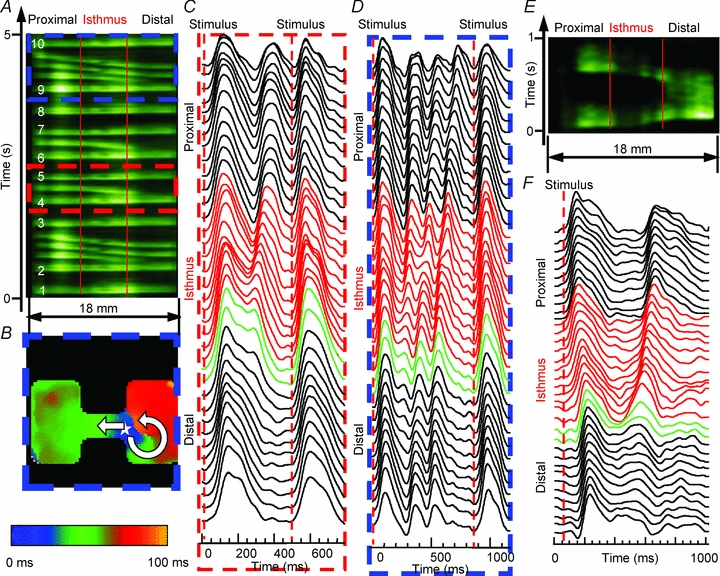
A, average TSP for pixels along horizontal lines that traversed the isthmus from an Ad-Nav1.5 monolayer (2-mm-wide isthmus; red vertical lines demark the structural heterogeneity). Stimulation was at 2 Hz on the proximal (left) side, and the impulse traversed the isthmus and activated the large distal expansion (right), followed by the intermittent occurrence of reflection. Anterograde propagating waves are numbered in white. B, activation map illustrated that re-excitation (star) led to reflection, and a small distal area beneath the expansion was re-excited, which resulted in unidirectional propagation and an anticlockwise rotor. C and D, optical AP recordings during the time period within the red dashed and blue dashed boxes in A, respectively. The red APs are from pixels within the isthmus, and green APs are pixels within the first 500 μm of the distal expansion. E, average TSP from another Ad-Nav1.5 monolayer (0.5-mm-wide isthmus, 3 Hz stimulation) exhibiting reflection. F, optical AP recordings across the preparation in E.