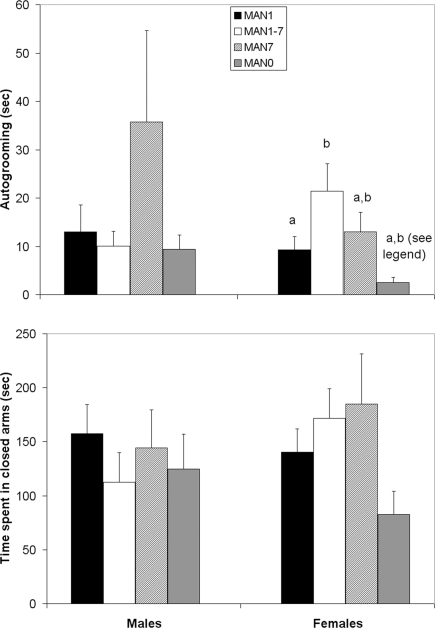
Figure 2.
Time spent autogrooming in the elevated plus-maze differed among treatment groups in females (F3 = 4. 38, p = 0.012). There was a trend for time spent in the closed arms to differ (Kruskal–Wallis test, χ2 = 7.14, p = 0.067). Groups which differ significantly from each other in the overall ANOVA are indicated by different letters. When MAN1 and MAN0 females were compared directly in pre-planned comparisons, MAN1 females autogroomed significantly more than MAN0 females (F1 = 4.87, p = 0.041) and MAN1 females tended to spend more time in the closed arms than MAN0 females (F1 = 3.38, p = 0.084).

