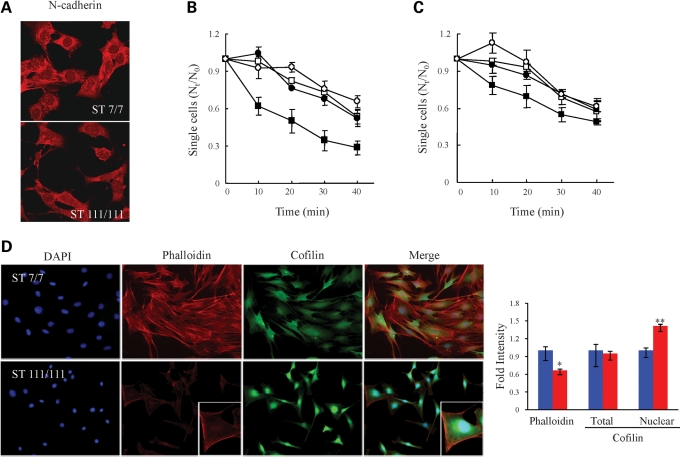
Figure 2.
STHdhQ111/Q111 striatal cells exhibited decreased N-cadherin function. (A) Confocal images of the N-cadherin immunostain signal (red) in wild-type STHdhQ7/Q7 (ST7/7) and STHdhQ111/Q111 (ST111/111) striatal cells, indicating decreased N-cadherin signal at STHdhQ111/Q111cell–cell contacts. (B) Plot summarizing the results of three independent cell-clustering assays, showing the proportion of single cells compared with time zero (Nt/N0) (y-axis) relative to time of clustering (x-axis) for STHdhQ7/Q7 (square) and STHdhQ111/Q111 (circle) striatal cells, in the absence (open symbols) and presence (closed symbols) of Ca2+, illustrating that mutant striatal cells exhibit impaired calcium-dependent clustering. Error bars denote the standard deviation. (C) Plot summarizing the results of three independent STHdhQ111/Q111 cell-clustering assays for cells transfected with the phN-cad human N-cadherin expression vector (squares) or with the control vector (circles), performed in the absence (open symbols) and presence (closed symbols) of Ca2+. Error bars denote the standard deviation. (D) Fluorescence images of STHdhQ7/Q7 (ST7/7) and STHdhQ111/Q111 (ST111/111) striatal cells, showing the pattern of DAPI (blue) nuclei, TRITC–phalloidin (red) F-actin signal and anti-cofilin (green) immunostain, illustrating decreased nuclear size, paucity of actin stress fibers and bright perinuclear cofilin stain of the mutant cells, consistent with an elongated rounded-up (less flat) morphology. The adjacent bar graph shows the average phalloidin signal and the total or nuclear area cofilin intensities. The average intensity of the phalloidin signal was significantly reduced in mutant striatal cells (*P < 0.001) and the inset was taken at different exposure conditions to examine the pattern of the phalloidin signal in mutant cells. The average intensity of the total cofilin signal was not altered but its localization was shifted to the nuclear and perinuclear region (**P < 0.001). Error bars represent standard errors.

