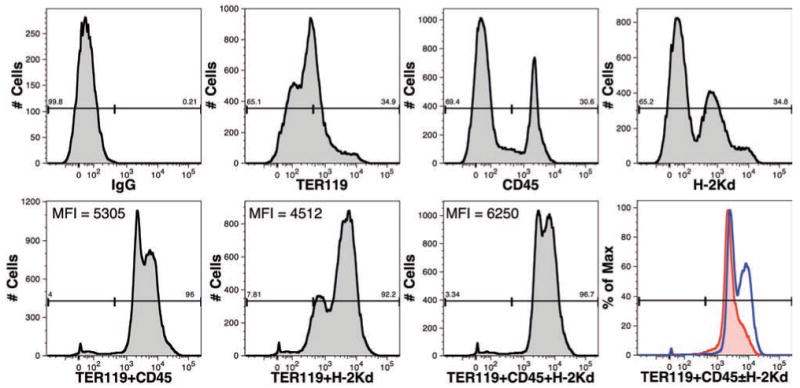
Figure 1.

Comparison of cell-surface markers for the identification of mouse cells. The expression of TER-119, CD45 and H-2Kd on BM cells isolated from an untransplanted NSG mouse was examined. All mAbs were conjugated to PB. Numbers above the gates represent the percentage of events falling within the gate. Additionally, the mean fluorescence intensity (MFI) is shown for cells stained with combinations of mAbs. An overlay of samples stained with TER119+CD45 (red line) and TER119+CD45+H-2Kd (blue line) is shown for a second independent sample of NSG-BM indicating that the highest intensity staining is achieved with all three mAbs.
