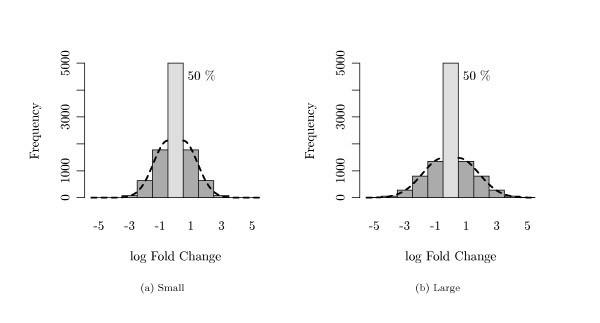
Figure 3.
Simulated Log Fold Changes. Both plots display a distribution of log fold changes of the genes between short and long time survivors in the setting where 50% of all genes were not altered between both groups. Fold changes were drawn from a 'discretized' normal distribution (dashed line). (a) small fold changes, (b) large fold changes.

