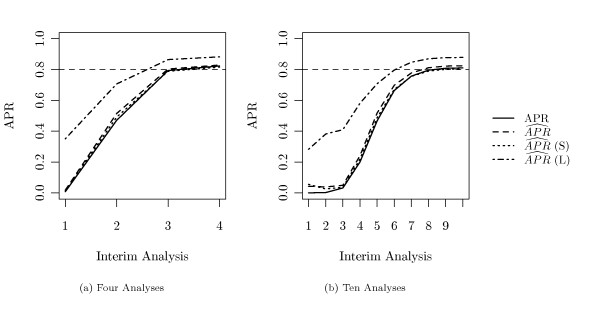
Figure 5.
Simulated Power Rate (τ = 50%). True (solid line) and estimated (broken lines) average power rates (APR) at each interim analysis in the setting where 50% of all genes were altered between both groups. (a) M = 4 analyses, (b) M = 10 analyses. The dashed line marks the pre-specified stopping criterion, i.e. an estimated APR of 80%.

