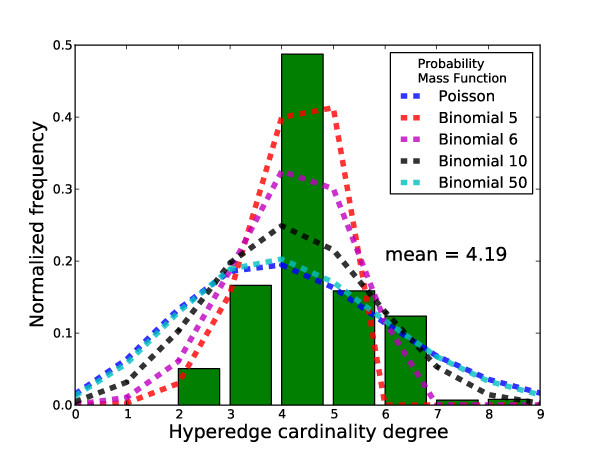
Figure 3.
The hyperedge cardinality distribution of the metabolic hypergraph of E. coli. Poisson distribution and Binomial distribution with different sample sizes are shown in dashed lines. Parameters of these distributions (μ for Poisson and p for binomial) are chosen such that their means equal the actual value (419).

