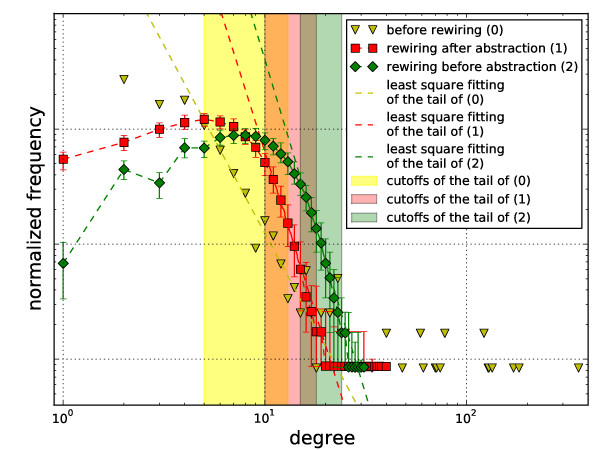
Figure 5.
Comparison of the degree distributions of the metabolic standard graph of E. coli against two different null models. The degree distributions are derived based on three versions of the metabolic hypergraph of E. coli: The trans-primal of the hypergraph (0), the rewired trans-primal of the hypergraph (1), and the trans-primal of the rewired hypergraph (2). Least-squares fitting of the tail of (0) and the medians of (1) and (2) to p(k) = βk-α yields values of α = 3.26 for (0), α = 5.59 for (1), and α = 5.82 for (2). For degree 100 = 1, the point for (0) coincides with that for (1).

