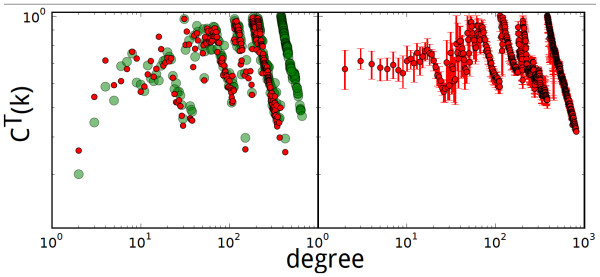
Figure 7.
The scaling of averaged clustering coefficients in the reaction graph obtained via PLGT. Left panel: The green dots are the average clustering coefficients of the PLGT of E. coli's hypergraph. The red dots are the same, but with the water molecule excluded. Right panel: The red dots are the average clustering coefficients of the rewired hypergraph, which is generated by first taking the dual of E. coli's metabolic hypergraph and then rewiring it (1 × 10⁶ times, to guarantee convergence).

