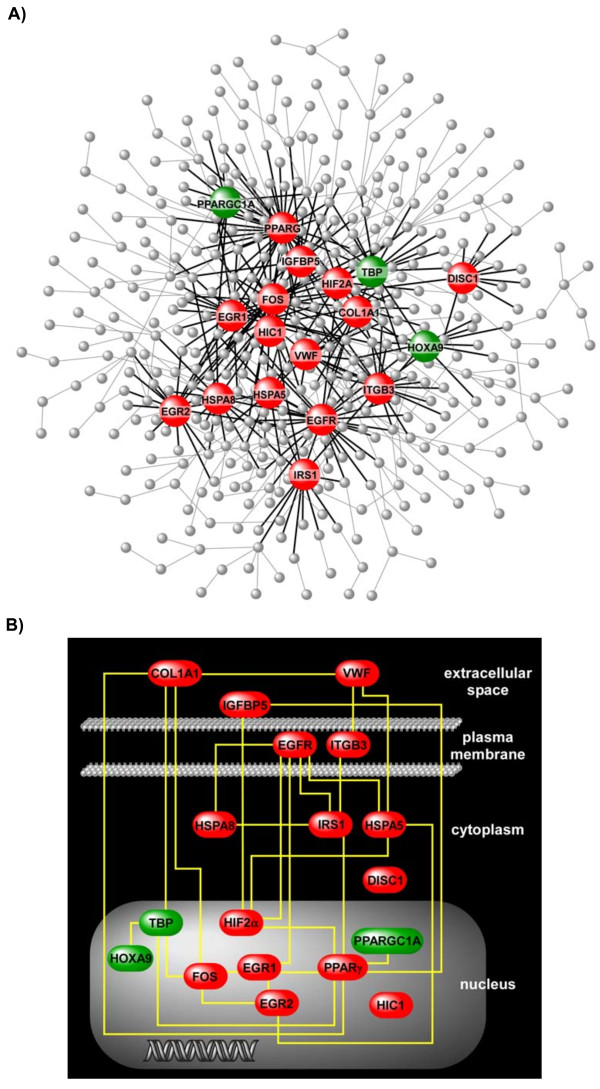
Figure 5.
Differentially expressed hubs of the hypoxia-induced VSEL interactome. Panel (A) depicts the full network while highlighting the18 hubs with ≥ 10 edges and their respective connections (see also Additional file 2, Figure S1). Note that these densely connected nodes capture a significant proportion of the overall network connectivity (313 out of 604 connections). Red: upregulated in hypoxia, Green: downregulated in hypoxia. Panel (B) is a wiring diagram limited to the interconnections among the network hubs, with each gene product placed within its cellular compartment. This genetic circuit is postulated to encompass key controllers of stem cell responses during in vivo hypoxia.

