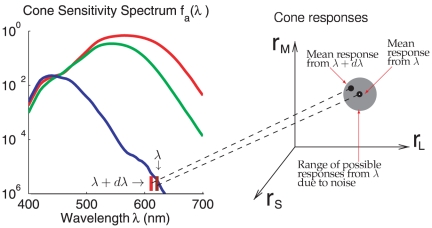
Figure 1. Illustrations of noisy encoding of monochromatic inputs by the cone responses.
On the left is the cone spectral sensitivity
 (with
(with
 , where
 s are
derived from the Smith and Pokorny cone fundamentals[15], the
cone density ratio is
  , the
pre-receptor light transmission factors
  , and
Max
 ). A
monochromatic input of wavelength
  evokes
response
  from the
three cones, L, M, and S. Due to input noise, there is a range of
possible responses
  from this
input. If the mean response to a monochromatic input of nearby
wavelength
  is one of
the typical responses within this range of responses
 to input
 , then it
will be difficult to perceptually distinguish the input
 from input
 .
.

