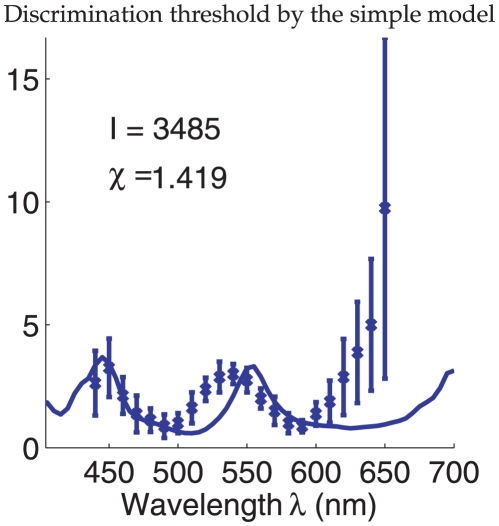
Figure 2. Wavelength discrimination assuming input intensity
 is fixed
and known during color matching.
It is by maximum likelihood decoding of the cone responses
 using the
simple model. The solid curve plots the discrimination threshold
 as a
function of
  from the
model. The data points with error bars are the mean
 and the
standard deviation
  of the
discrimination thresholds of the four observers of Pokorny and
Smith[1]. In fitting the model to the data,
 is chosen
such that the quantity
  is
minimized.

