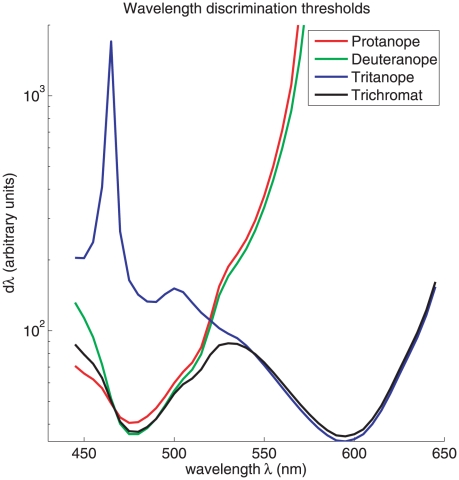
Figure 7. Theoretical preditions of the wavelength discrimination by dichromatics as compared to that by the trichromats.
All these curves are by fixing input intensity
 , while using
  in which
 is normalized by Max
 , while
 are no longer normalized by
Max
 . The values
 are
are  ,
,
 ,
,  , and
, and
 for protanopes, deuteranopes, tritanopes, and
trichromats, respectively.

