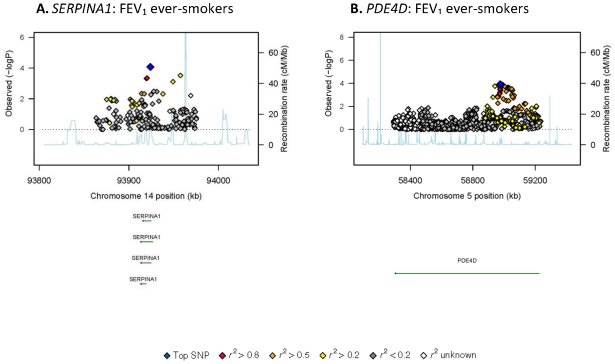
Figure 2. Regional association plots for SERPINA1 (A) and PDE4D among ever-smokers (B) in SpiroMeta.
Statistical significance of each SNP on the −log10 scale as a function of chromosome position (NCBI build 36). The sentinel SNP at each locus is shown in blue; the correlations (r 2) of each of the surrounding SNPs to the sentinel SNP are shown in the indicated colours. The relevant trait (FEV1 or FEV1/FVC ratio) is indicated for each plot. Recombination rate is shown in pale blue.

