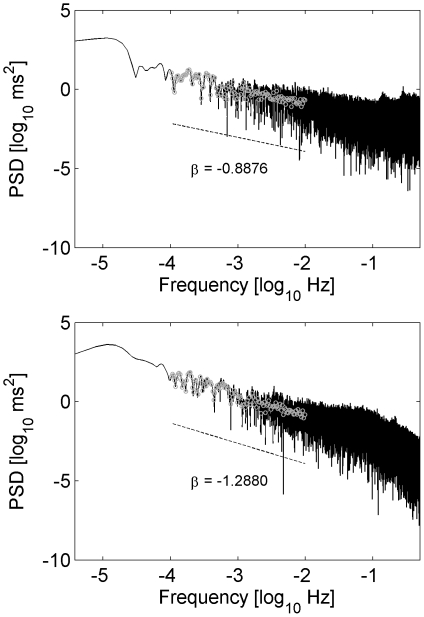
Figure 1. Examples of the power spectral density (PSD) of a 24 h R-R interval series in a double logarithmic plot (decadic logarithm as indicated by ‘log10’).
The slope β denotes the slope of the linear regression calculated using the averaged PSD (grey circles; frequency range: 10−4 to 10−2 Hz). Top: male subject, age 7.9 years; bottom: male subject, age 18.1 years.

