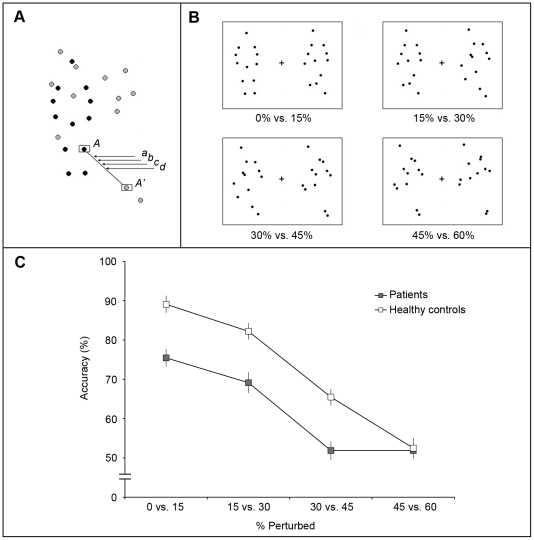
Figure 2. Experiment 2: Discrimination of perturbation of biological motion.
A: A series of parametrically perturbed motion sequences was created from 10 different PL animations each depicting a different human activity. These ten different PL animations comprised 2 portraying jumping (standing jump, rope-jumping), 3 kicking (toward front, toward side, and soccer kicking), 3 throwing (tossing, bowling, overhead throwing), 1 crouching for high jump, and 1 backward walking. In this example, black dots indicate the dots forming a single frame of a normal biological PL sequence and gray dots illustrate the corresponding frame of spatially scrambled version of this sequence. For example, dot A' indicates a new location of dot A when the motion is 100% spatially scrambled. The position denoted as (a) corresponds to an intermediate position that divides the distance between A and A' in the ratio of 15∶85. Therefore, when the position ‘(a)’s are taken from all the other pairs of biological-scrambled dots, a sequence containing 15% perturbed biological motion is generated. In the same way, (b),(c), and (d) represent the dot positions of 30%, 45%, and 60% perturbed motion. B: Single frame exemplars of the four discrimination conditions. Over trials, these pairs of animations portraying differing degrees of perturbation were presented in random order, and following each trial the participant indicated which one (left or right) was closer to unperturbed human motion. The % values below each figure refer to the percent of spatial perturbation. C: Performance (accuracy of discrimination) on the task in the schizophrenia group (filled symbols) and the healthy control group (open symbols). Error bars indicate ±1 standard error of the mean (SE). Chance performance on this 2AFC task corresponds to 50% correct.

