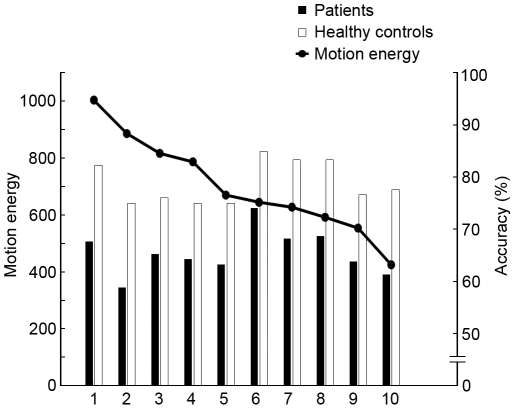
Figure 3. Experiment 2: Performance for each distinct activity.
Each activity animation was quantified in terms of the total motion energy in that animation (defined by the total excursion of dots over space and time during the 1 sec presentation). The motion energy of each animation is speicified by the y-axis on the left-hand side of the graph, and the animations are ordered from most to least motion energy along the x-axis. (1 = standing jump; 2 = kicking side; 3 = crouching jump; 4 = soccer kicking; 5 = kicking front; 6 = backward walking; 7 = bowling; 8 = rope jumping; 9 = tossing; 10 = overhead throwing). The histogram bars show average discrimination performance associated with each activity pooled across all perturbation pairings except the most extreme perturbations where performance on the task was impossible. Filled bars are for schizophrenia patients and open bars for healthy controls. There is no correlation between performance and total motion energy.

