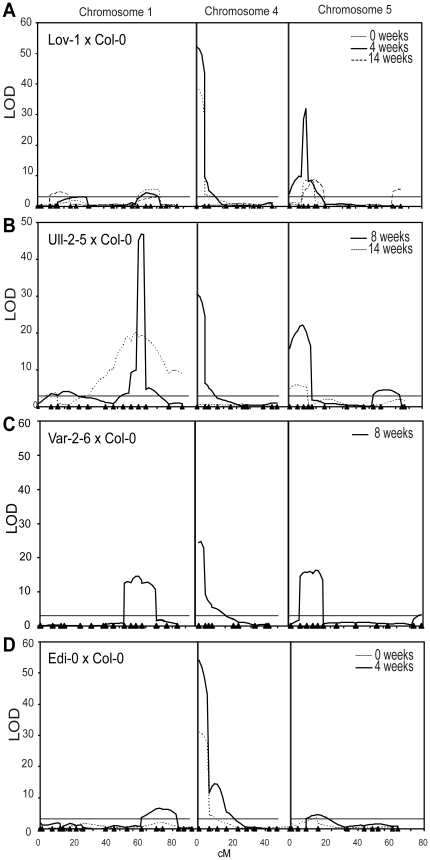
Figure 1. QTL analysis for variation in vernalization response.
Composite interval mapping was used to identify genes contributing to the variation in vernalization response after treatment of Arabidopsis populations with different lengths of cold. (A) Lov-1 × Col-0, (B) Ull-2-5 × Col-0, (C) Var-2-6 × Col-0 and (D) Edi-0 × Col-0. Each chromosome with significant QTL (chromosome 1, 4 and 5) is shown separately and the positions (in cM) of the markers used are indicated as triangles. LOD (Logarithm of odds) scores were calculated by QTL Cartographer with a 5 % significance threshold (shown as dashed lines) determined from a 1000 permutation test. For (B) Ull-2-5 x Col this resulted in a high threshold due to segregation distortion, which is widespread in this cross (Figure S2). Each chromosome was tested individually and chromosome 3 identified as the cause of the high threshold. The permutation analysis was then performed excluding chromosome 3.

