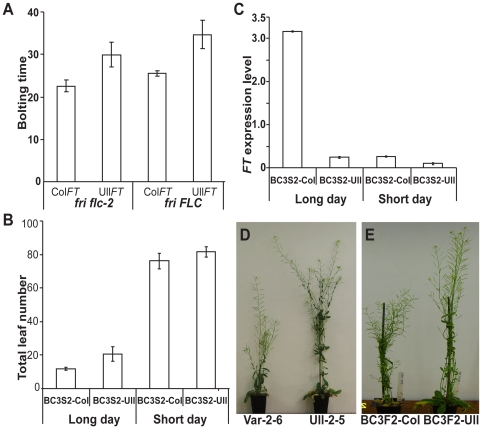
Figure 3. Functional analysis of the Ull-2-5 FT allele using backcrossed populations.
(A) Comparison of the contribution of Ull-2-5 and Col-0 FT alleles to flowering time with or without a functional FLC. (B) Comparison of flowering time between BC3S2-Ull and BC3S2-Col in long and short day growth conditions. (C) FT expression of Col-0 and Ull-2-5 alleles in response to different day lengths (D) Final size of plants vernalized for 10 weeks and then grown in a greenhouse. (E) Plant size of BC3S2-Col (left) and BC3S2-Ull (right) in long day growth condition. Error bars in (A) show S. D. of 20 individual plants, in (B) and (C) they show S. D. from three experimental replicates.

