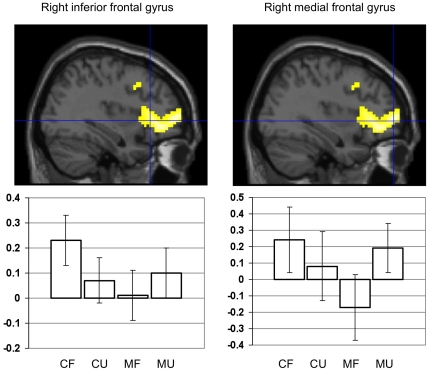
Figure 1. Between-group comparison: personal familiarity irrespective of stimulus type.
The figure shows brain areas with relative decrease in neural activity among aMCI patients when compared to control subjects, associated with familiar>unfamiliar stimulus content irrespective of stimulus type. The two local maxima (indicated by crosshair positions) are superimposed on a sagittal single subject brain section provided by SPM5. Both maxima are part of the same cluster (for details see Table 3). The histograms display percentage BOLD signal change for the local maximum as a function of the experimental conditions (mean and 90% confidence interval). CF = controls familiar, CU = controls unfamiliar, MF = aMCI familiar, MU = aMCI unfamiliar.

