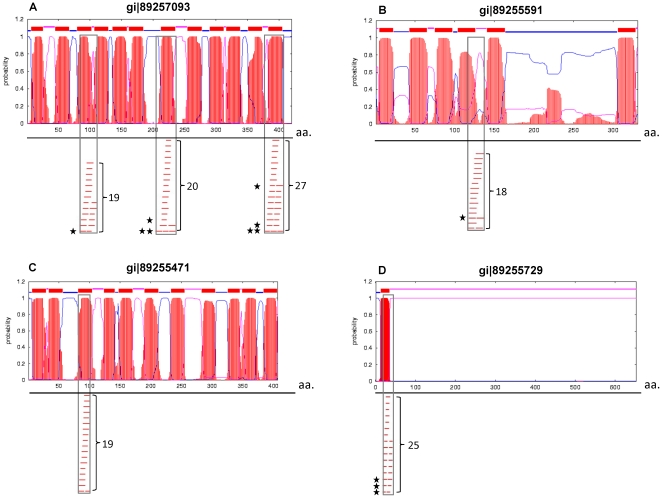
Figure 4. Alignment of “hotspots” of putative CTL epitopes with secondary structure domains.
Sample plots of predicted helix-spanning regions of four selected proteins (graphical presentation of the output generated by TMHMM prediction), aligned with the highly-dense cluster regions of putative CTL peptides mapped in this study. Briefly, red segments represent the probability of having a helical region, while the thin blue and pink lines describe a possible topology of the membranal helices. In the lower part of every protein chart, a bar represents a predicted CTL binder. Co-localization of the putative MHC binders with the predicted helix or loop region in the protein is marked by a grey box. The total number of predicted CTL epitopes in the hotspot region is given on the rightside of the grey bar, and the stars on the leftside indicate responders. Note, that in example D, the predicted helix segment overlaps a signal peptide domain, which contains only one out of the three marked responders in the cluster.

