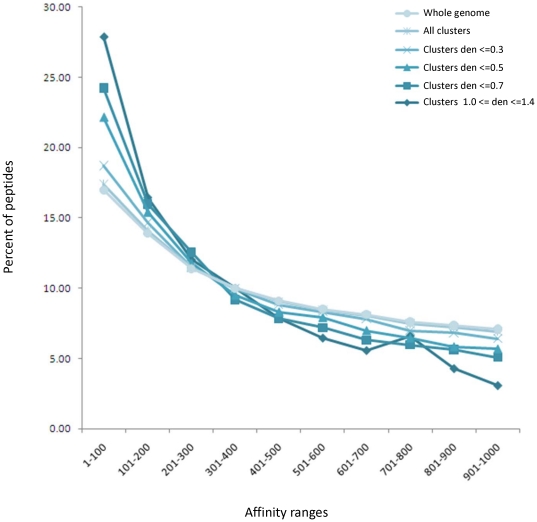
Figure 5. Distribution of peptide affinities in various pools of predicted MHC binders.
The percent of peptides populating a range of affinities up to 1000 nM is indicated for the following pools: Whole genome (circle) −90,879 peptides; all mapped clusters (star) −75,785 peptides; clusters with densities up to 0.3 (x sign) −60,870 peptides, up to 0.5 (triangle) −26,699 peptides, up to 0.7 (square) −9,240 peptides, 1.0–1.4 (diamond) −1240 peptides.

