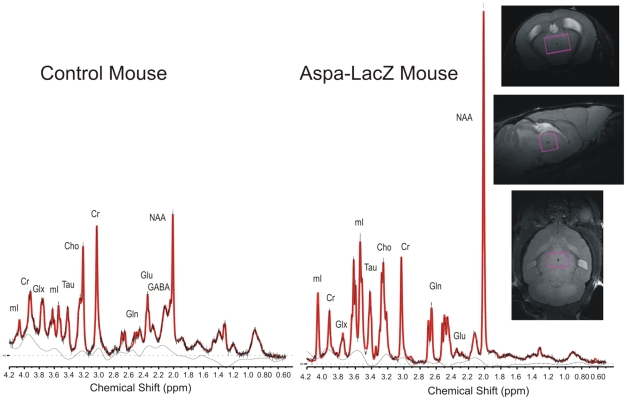
Figure 7. 1H-MRS analysis.
Spectra were acquired from aspa+/+ and aspalacZ/lacZ littermates using a 2×2×3 mm3 single-voxel PRESS Sequence in the thalamus. Representativ metabolites are marked in the spectra (Cr: Creatine and Phosphocreatine, NAA: NAA+NAAG, Cho: Phosphocholine and Glycerophosphorylcholine, Glu: Glutamate, Gln: Glutamine, mI: Myo-Inositol, Tau: Taurine, Glx: Glu+Gln). For metabolite concentrations see Table 1.

