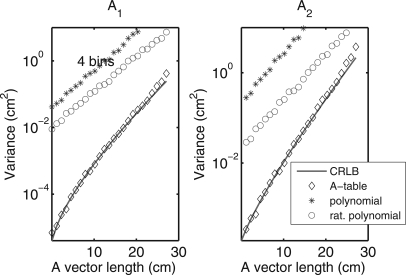
Figure 10.
Variance for PHA data with four bins on line (b) in Fig. 6. With four bins, the polynomial and rational polynomial results are different but are both much larger than the A-table results, which are shown as black diamonds. The A-table results are essentially equal to the CRLB.

