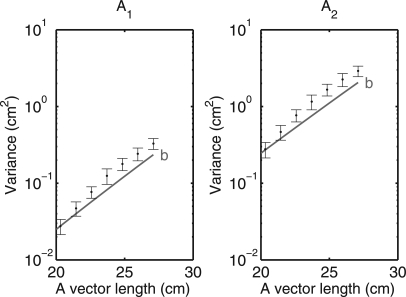
Figure 12.
Replot of data for the region at the end of line (b) of Fig. 11 with error bars corresponding to ±2 standard deviations. In this region, the variance deviates from the CRLB although the differences are only approximately twice the standard deviation of the variance estimates from the Monte Carlo simulation.

