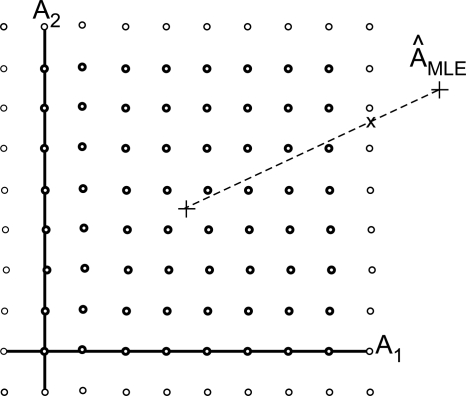
Figure 5.
Algorithm for data that fall outside calibration region. The calibration table is extrapolated using the gridfit function as shown by the light circles. For data that are outside this region, the table value at the nearest boundary on a line joining the point and data centroid is used. This is the point marked with the X.

