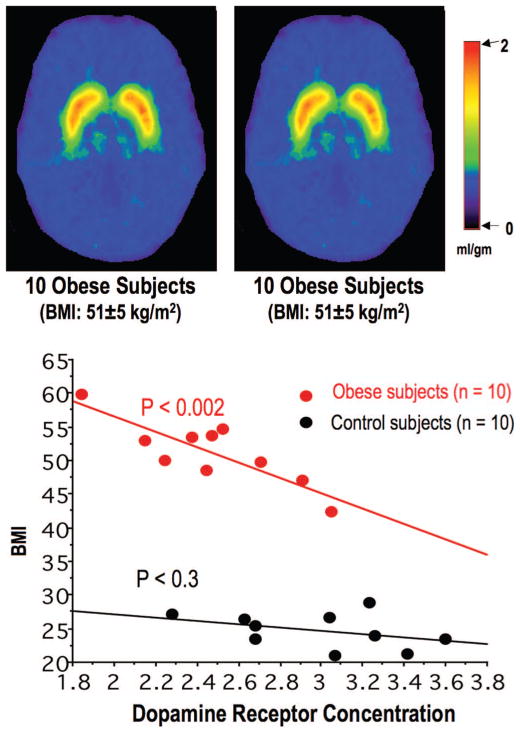
FIGURE 3.
Group averaged images of [11C]raclopride PET scans for obese and control subjects at the level of the basal ganglia. The images are scaled with respect to the maximum value (distribution volume) obtained on the control subjects and presented using the rainbow scale. Red represents the highest value (2.0) and dark violet represents the lowest value (0 mL/gm). The obese subjects have lower D2R availability when compared with the control subjects. Linear regression between D2R availability (Bmax/Kd) and BMI shows that the D2R availability levels were inversely related to body mass index (BMI) in the obese subjects but not in the control subjects. (Adapted from Lancet. 2001;357:354–357.)

