
Fig. 4.
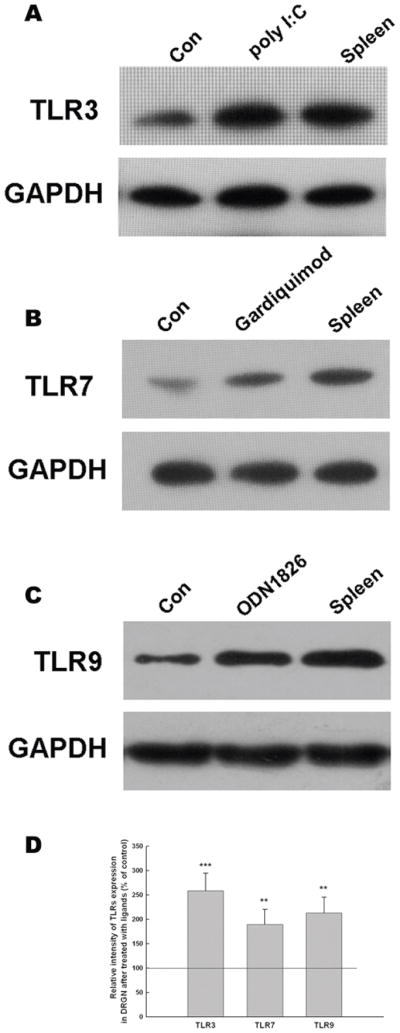
TLR ligands induce corresponding receptor expression by DRGNs. Western blot showing TLR3, TLR7 and TLR9 expression by DRGNs following ligand stimulation are shown. (A) poly I:C (25 μg/ml) induced TLR3 protein expression, (B) gardiquimod (3 μg/ml) induced TLR7 protein expression, and (C) ODN 1826 (32 μg/ml) induced TLR9 expression in DRGNs. (D) Densitometry from the blots. Cells were stimulated for 16 hrs then harvested, lysed, and the protein extracts were probed with anti-TLR3, anti-TLR7, and anti-TLR9 antibody. Control (Con) samples were cultured for 16 hrs without additional stimulation. Protein loading is reported using an anti-GPDH antibody. Spleen lysate was used as a positive control. One representative of more than three independent experiments is shown. Image densitometry were performed using ImageJ software. The densitometry results were determined for 5 sites within each band, presented as mean ± S.E.M., are expressed as percentages of levels in control group (100%). GAPDH was utilized as internal control. Statistics analysis was performed using Student’s t test for two-group comparisons. **P <0.01, ***P <0.001 compared with control.