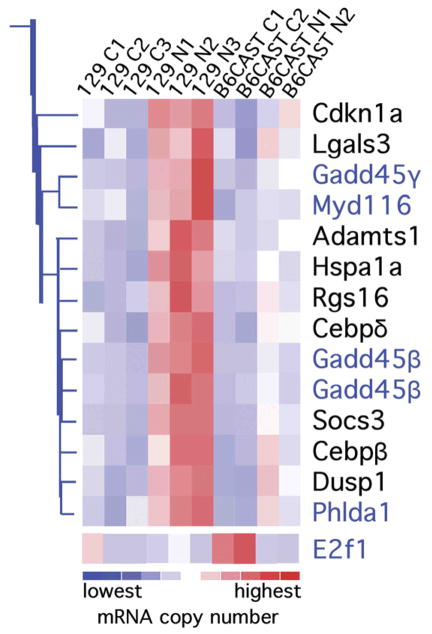
Fig. 2.
A branch of an expression profile analysis tree clustered apoptosis modulators differentially expressed after noise exposure in 129 mice. The gene expression levels are shown for each array, as indicated at the top of the figure (see Table 1). The mice were sacrificed 6 h after the exposure to a 1-h, 105-dB SPL, 10-kHz OBN or sham exposure. Gene clustering of all the differentially expressed probe sets was performed using dChip and according to their expression profiles. This branch cluster is shown because this branch segregated most of the differentially expressed genes known to modulate apoptosis pathways; including Cdkn1 encoding p21cip1, Hspa1a encoding HSP70, and Gadd45β encoding GADD45β (see text). The genes in blue type are the ones for which dChip assigned apoptosis Gene Ontology annotations. E2f1 was the only differentially expressed gene for which dChip contains apoptosis Gene Ontology annotations, and although it did not cluster with the other apoptosis-related genes, it is included in the figure. The color key at the bottom of the illustration indicates the amount of over- (reds) or under-expression (blues). C=control, N=noise exposed group; in the array names.

