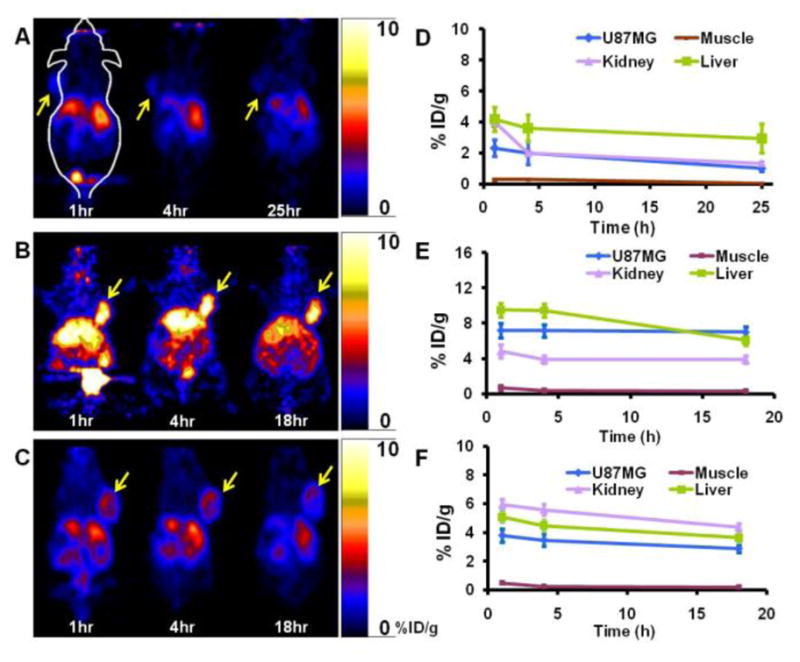
Figure 2.

A, B and C: Representative coronal microPET images of the U87MG tumor-bearing mice at different time points (1, 4, 18 or 25 h) post-injection of 64Cu-DOTA-P1, 64Cu-DOTA-P2, and 64Cu-DOTA-P3, respectively (arrows indicate tumors). D, E, and F: MicroPET quantification results, expressed as percentage of injected dose per gram (%ID/g), in different organs and tumor of subcutaneous U87MG glioblastoma xenograft model after intravenous injection of 64Cu-DOTA-P1, 64Cu-DOTA-P2, and 64Cu-DOTA-P3, respectively.
