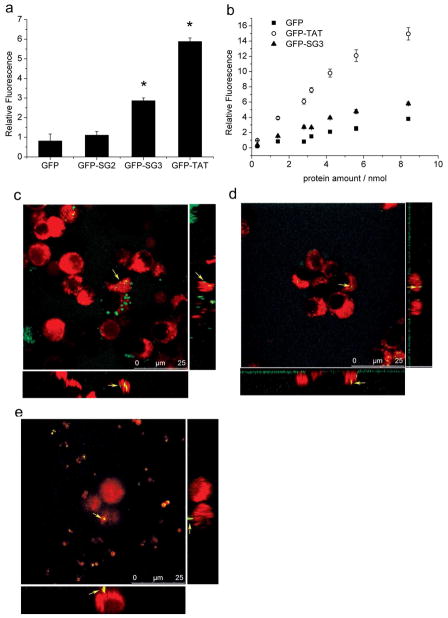
Figure 2.
Delivery of GFP to PC12 cells using peptides identified from the library selection. A. Fusion proteins (2.8 nmol) were added to PC12 cells in a 24-well plate and analyzed by flow cytometry. B. Dose-dependent uptake of fluorescent fusions by PC12 cells: GFP (■), GFP-TAT (▲) and GFP-SG3 (○). In both panels, each experiment was performed in triplicate (n=3) and error bars represent standard errors. ‘*’ indicates the value is significantly different from the GFP treated control cells. C–E. Confocal microscopy analysis of fusion protein uptake by PC12 cells (Green: GFP signal; Red: CellTracker Red CMTPX; Yellow arrows: a typical spot on the image of Z plane, orthogonal X and Y plane). C: incubation for 4 hours with GFP-TAT, resulting in an overlap coefficient of 0.983; D: incubation for 4 hours with GFP-SG3, resulting in an overlap coefficient of 0.994; E: incubation for 4 hours with GFP, resulting in an overlap coefficient of 0.978.

