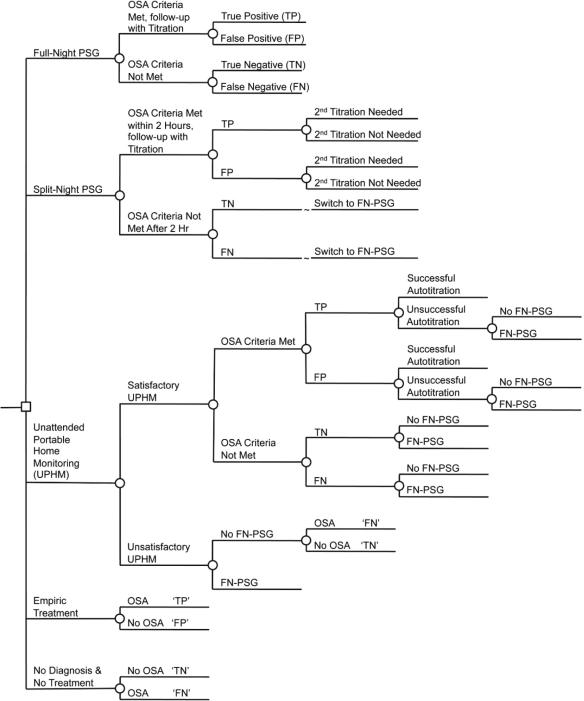
Figure 1.
Simplified illustration of the decision tree structure (diagnosis and titration only). The small square represents the decision to implement a strategy of using a specific diagnostic technology. Circles represent chance events. FN-PSG, Full-night polysomnography; SN-PSG, Split-night polysomnography; UPHM, Unattended Home Monitoring; TN, True Negative; FN, False Negative; TP, True Positive; FP, False Positive.

