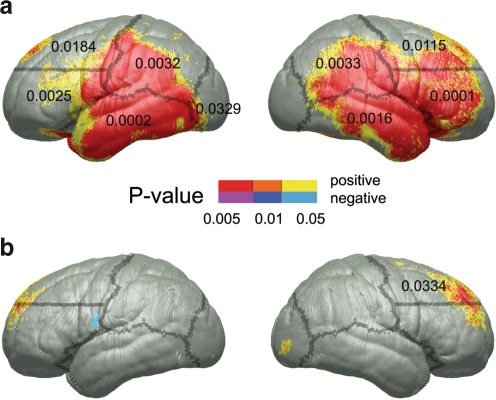
Fig. 3.
Sowell et al. (2008) demonstrated thicker cortices in alcohol-exposed subjects compared to healthy controls. The top row (a) shows the location of cortical thickness differences between exposed subjects and controls and the significance of those changes. They also observed correlations between the cortical thickness and performance on the CVLT-C, a test of verbal learning. The significant correlations were located in the right frontal lobe in exposed subjects (b). Figure used with permission

