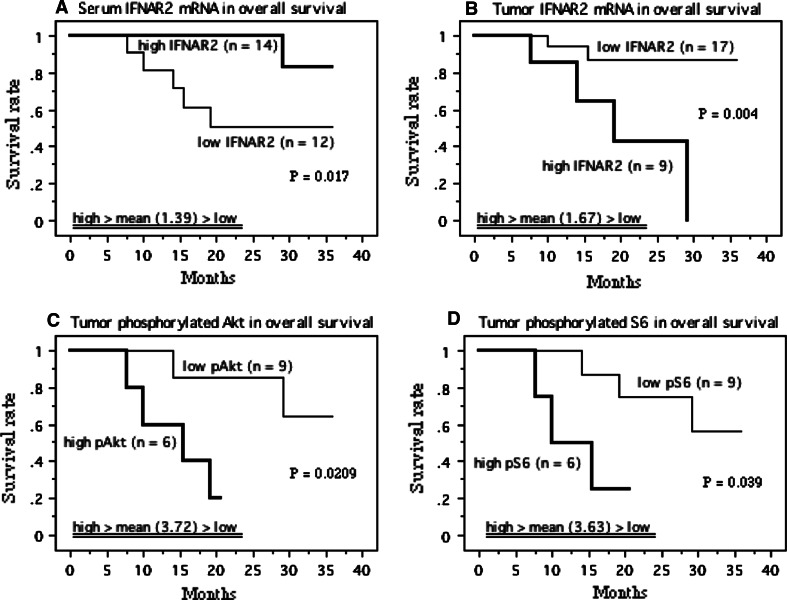
Fig. 10.
Survival curve in the patients with metastatic lesions (M1) based on the mean values of mRNA levels of serum and tumor lFNAR2 s, and of protein levels of tumor phosphorylated Akt (Ser-473) and phosphorylated S6 ribosomal protein (Ser-235/236), the cases were divided into two groups at this levels—high and low expression. Progression-free survival curve based on serum (a) and tumor IFNAR2 mRNA levels (b) in M1 patients treated with IFN-α ± sorafenib therapy. Progression-free survival curve based on tumor proteins for phosphorylated Akt (Ser-473) (c) and phosphorylated S6 ribosomal protein (Ser-235/236) (d) in M1 patients treated with IFN-α + sorafenib therapy. Overall survival curve based on serum (e) and tumor IFNAR2 mRNA levels (f) in M1 patients treated with IFN-α ± sorafenib therapy. Overall survival curve based on tumor proteins for phosphorylated Akt (Ser-473) (g) and phosphorylated S6 ribosomal protein (Ser-235/236) (h) in M1 patients treated with IFN-α + sorafenib therapy. P value was analyzed by log-rank test

