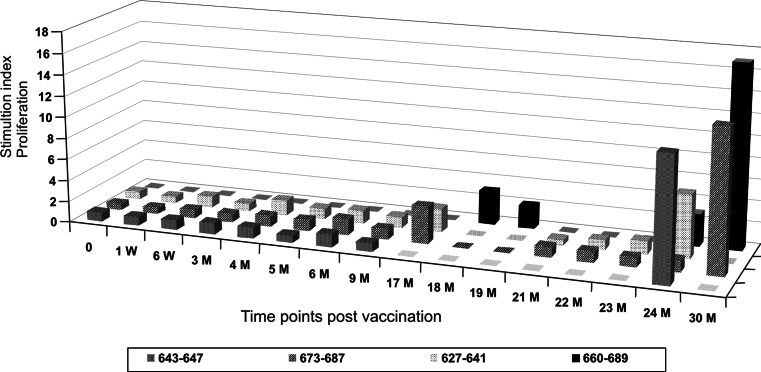
Fig. 4.
Representative pre- and post-vaccination T-cell responses against hTERT peptides. T-cell responses against selected peptides throughout the vaccination schedule. Non-peptide-loaded PBMCs were used as negative controls. W weeks and M months post-start of vaccination. Flat grey squares represent time points where T-cell responses against the peptide were not tested. Black bars represent responses against peptide 660–689, light hatched bars against peptide 627–641, more intense hatched bars against peptide 673–687 and grey hatched bars against peptide 643–647

