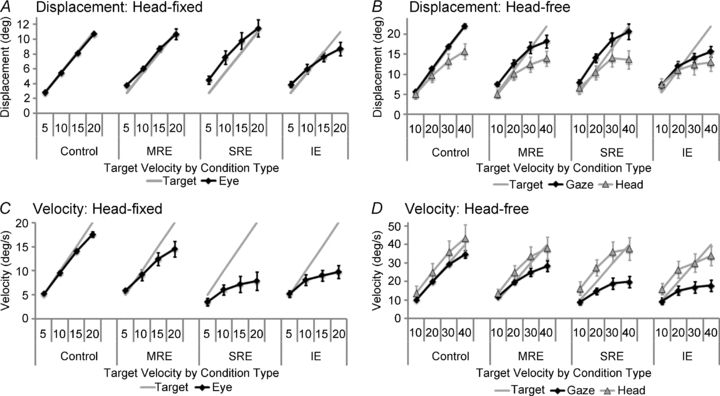
Figure 4. Displacement and velocity values at 750 ms (end-extinction equivalent time) for head-fixed and head-free protocols.

The figure shows average responses from all subjects for eye (head-fixed, left graphs), gaze (head-free, right graphs, squares) and head (right graphs, triangles). In the conditions where visual feedback is removed, eye and gaze displacement (A and B, respectively) were better matched to target displacement than eye and gaze velocity were to target velocity (C and D, respectively). The head-free responses show the head displacement and velocity, where the head contributes a substantial amount to the overall gaze displacement and head velocity is similar whether there is visual motion or not. Error bars denote ± 1 SEM.
