
Figure 9. Gaze and head velocity distributions at 600 ms.
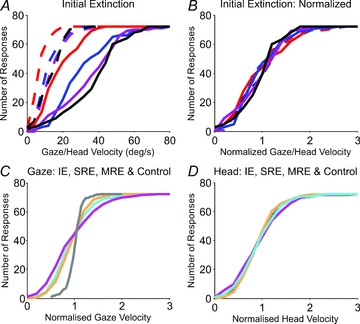
A, cumulative distribution of gaze (dashed lines) and head (continuous lines) velocity for each target velocity (10 deg s−1 (red), 20 deg s−1 (blue), 30 deg s−1 (purple) and 40 deg s−1(black)). B, data in A normalised to the mean gaze or head velocity and plotted against gaze or head velocity, respectively. Lower panels show a comparison of the normalised cumulative distribution of gaze velocity (C) and head velocity (D) for all test conditions: IE (magenta), SRE (cyan), MRE (orange) and Control (grey).