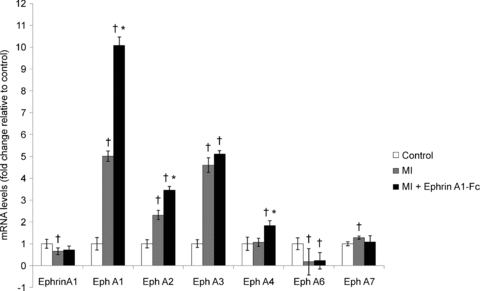
Figure 5. Altered gene expression of ephrinA1 and EphA receptors in response to MI and MI + ephrinA1-Fc.

Following MI, ephrinA1 gene expression was significantly reduced (grey bars), and remained relatively unchanged in response to ephrinA1-Fc administration (black bars). Receptors A1, A2, A3 and A7 were significantly upregulated in response to MI, by 5-fold, 2-fold, 5-fold and 28%, respectively, while EphA4 remained unchanged. EphA6 was detected in control hearts but dropped significantly following MI, and expression was not recovered with ephrinA1-Fc administration. In response to ephrinA1-Fc administration, receptors A1 and A2 were further upregulated, by approximately 2-fold each, and A4 was also upregulated by almost 2-fold. Values were calculated using the Ct method, normalized to GAPDH, and presented here as fold changes relative to uninjured control (white bars). n = 8 control, n = 8 MI, n = 8 ephrinA1-Fc. P < 0.05: †different from control, *different from MI.
