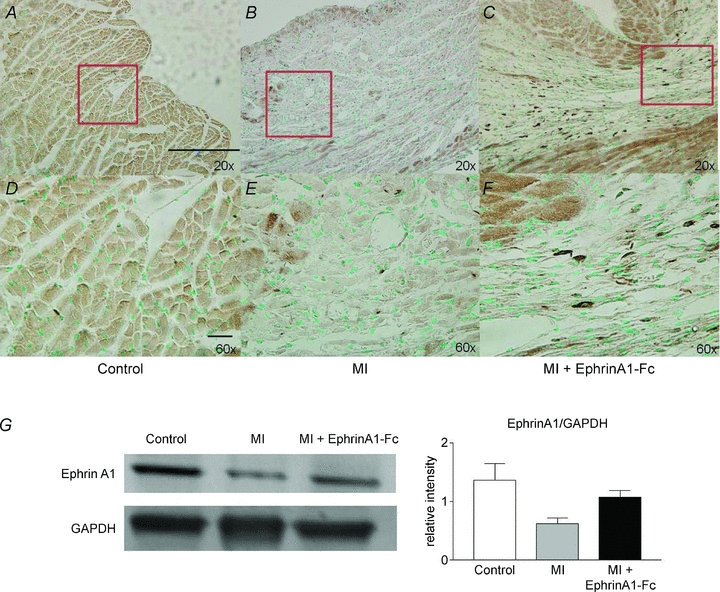
Figure 6. EphrinA1 protein distribution in the myocardium.

Representative immunostaining for ephrinA1 protein showed a low basal expression of ephrinA1 in cardiomyocytes of control hearts (A and D), intense staining in endo- and epicardial myocytes following 4 days non reperfused MI (B and E), and more intense staining in myocytes as well as numerous granulation tissue cells in the infarct zone following ephrinA1-Fc treatment at 4 days post-MI (C and F). EphrinA1 total protein expression (G) was reduced by 50% in response to MI, but only reduced 36% in response to ephrinA1-Fc administration (normalized to GAPDH). Scale bars: 100 μm in A, 20 μm in D.
